C++ coverage for Windows and AI workflows
See which code your tests cover.
Measure the Windows binary you already build, with its PDB. Give developers and AI agents the coverage to write better tests. No rebuild required.
Free for open source and personal use. There is no license key; you sign in once.
Read the workflow
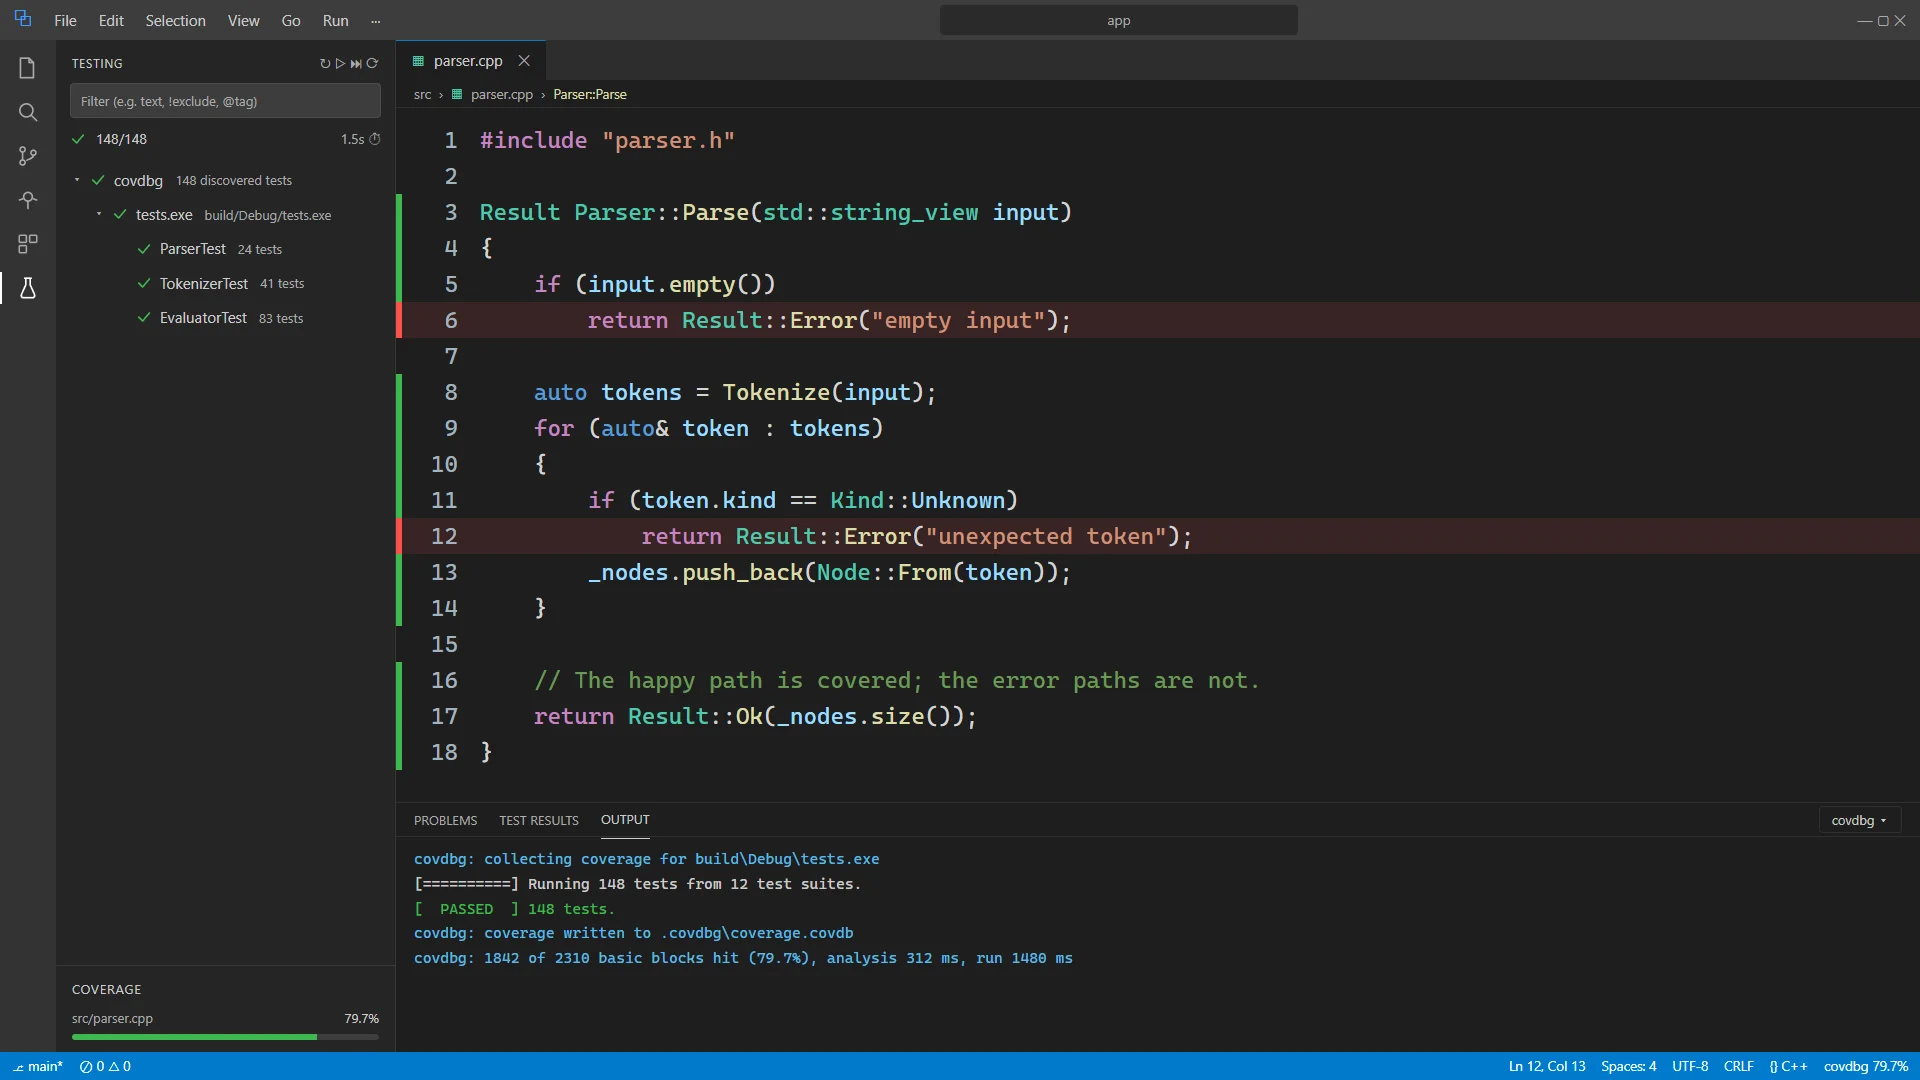
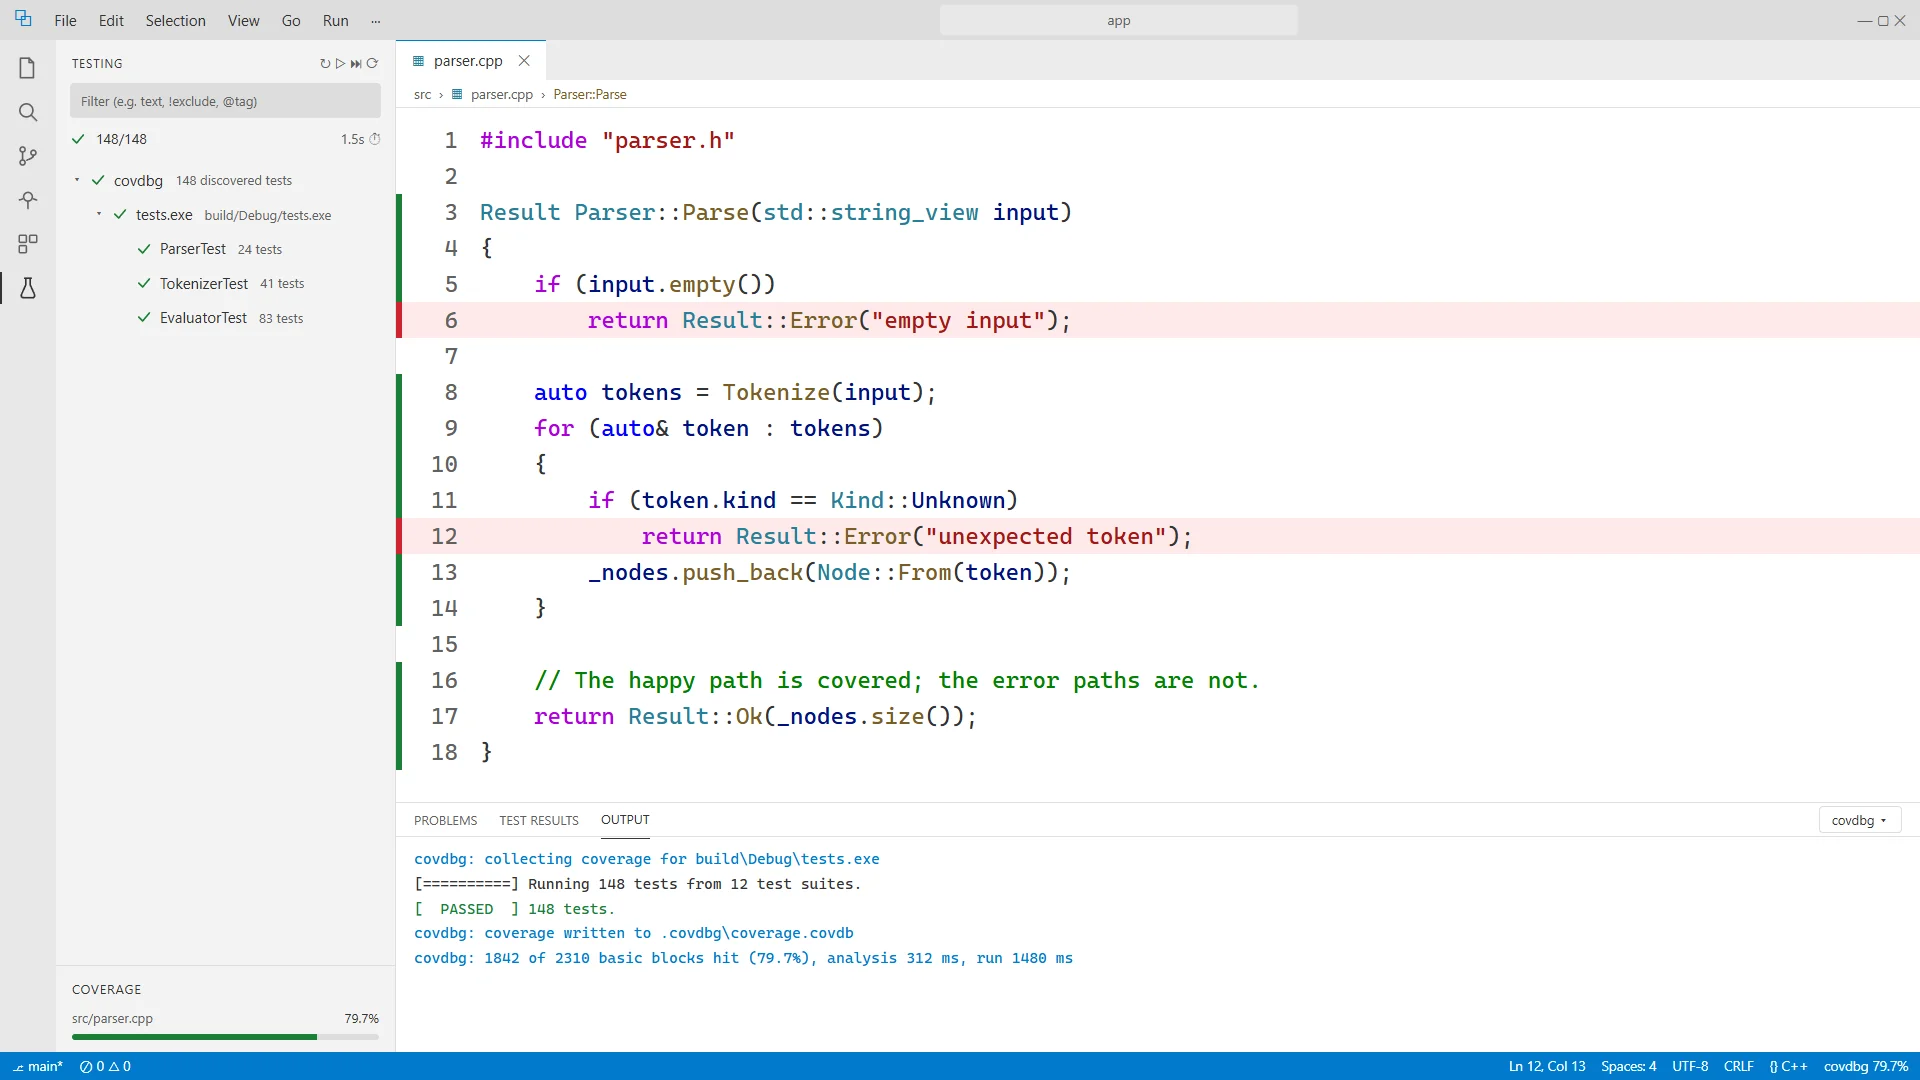
Run a test or a suite from Test Explorer. Coverage gutters identify lines that ran and lines that did not. Per-file coverage helps you find the untested paths while the code is open.
Test Explorer → Run tests → Inspect coverage guttersCoverage for your AI agent
Help your AI agent find untested code.
covdbg's built-in MCP server lets your coding agent run coverage, find untested paths, and read the surrounding source. The agent can add a focused test, run it, and check whether it exercised the gap.
The same measurements work for you in the editor, in an HTML report, and in CI. AI integration is part of the workflow, with your existing tests at its center.
- 01MeasureRun your real tests
- 02InspectFind uncovered paths
- 03ImproveAdd tests. Measure again.
Get started with covdbg
Run
Works with any Windows x64 binary that has a PDB: tests, services, or the application itself.
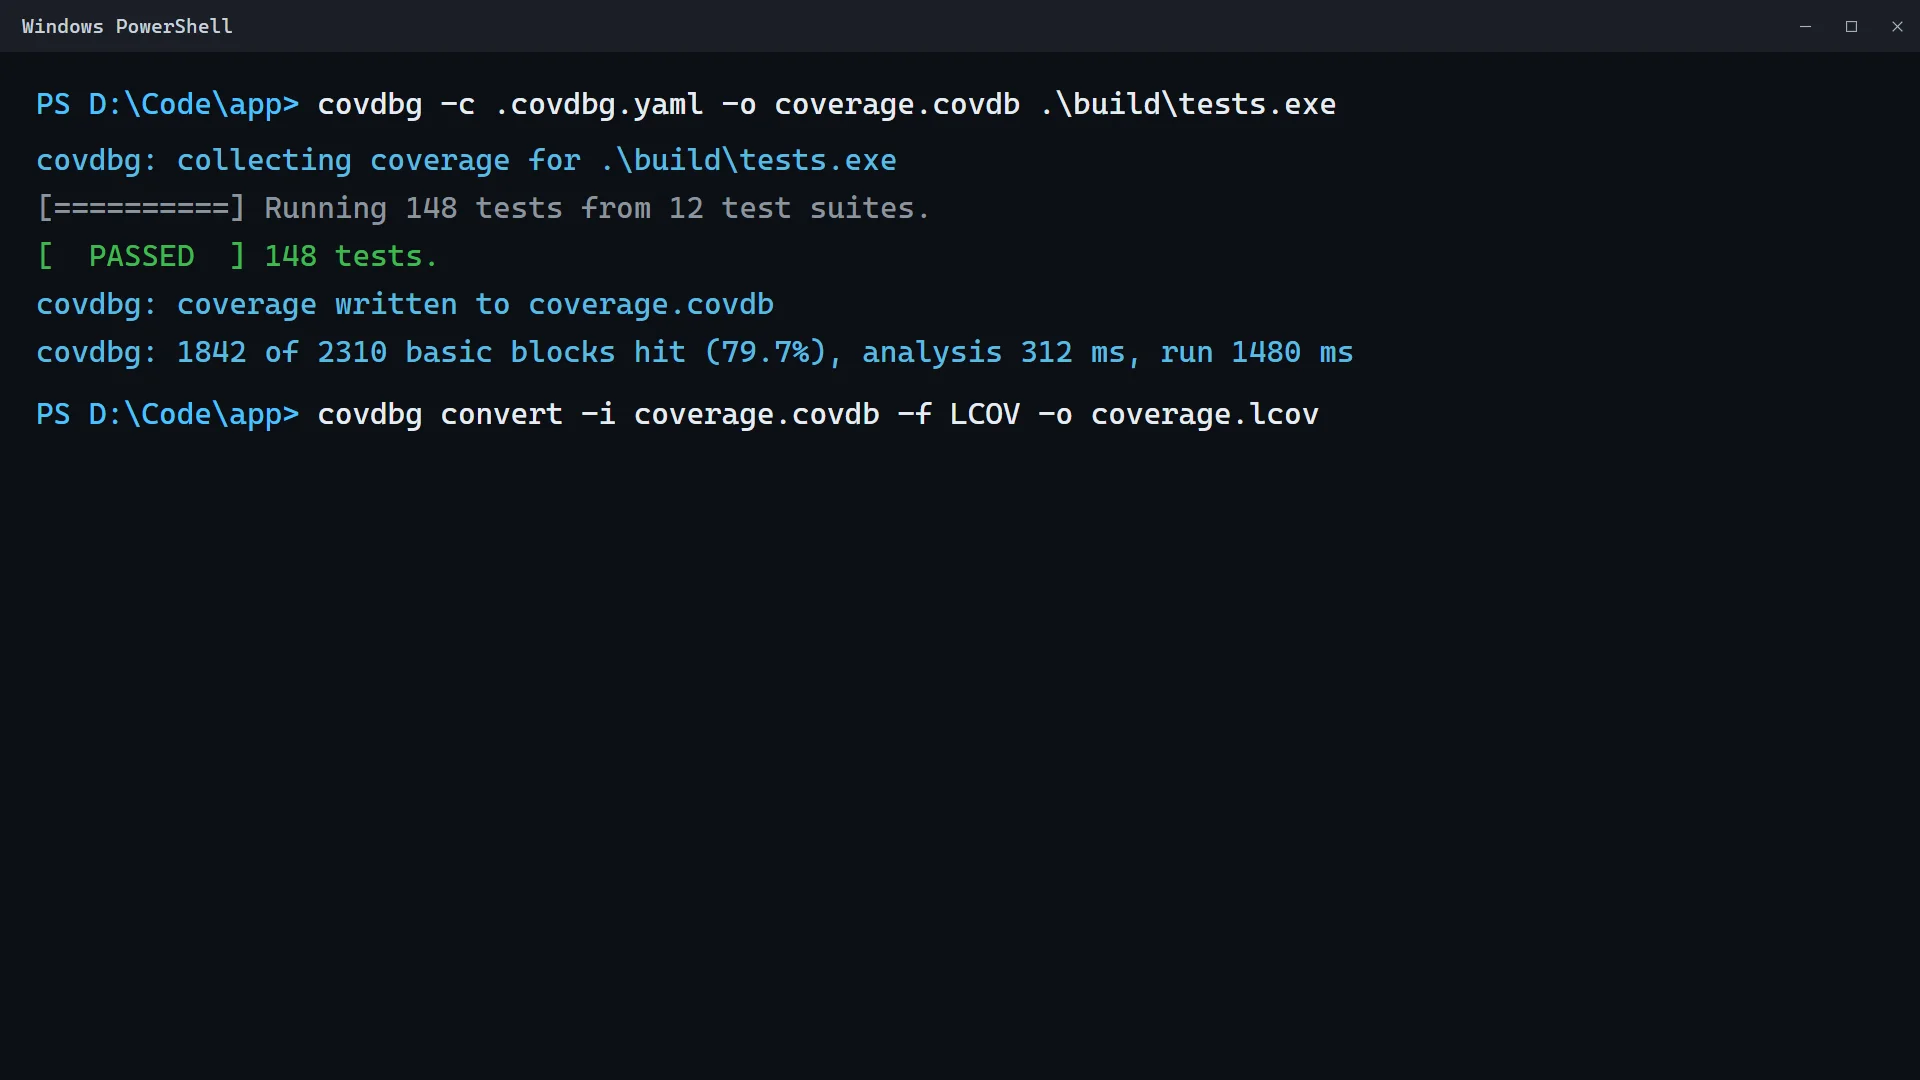
covdbg -c .covdbg.yaml -o coverage.covdb tests.exe Merge
Combine unit tests, integration runs, and a baseline of the whole application into one database.
covdbg merge -i unit.covdb -i integration.covdb -o all.covdb Export
Write LCOV, GCOV or HTML. Keep your existing quality gates and share a source-level report.
covdbg convert -i all.covdb -f LCOV -o coverage.lcov No rebuild
Coverage from the binary you already build.
covdbg works like a debugger. It starts your executable, reads the PDB, and places lightweight probes while the program runs. Your build stays as it is, with the same compiler, the same flags, and the same binary you ship.
- MSVC and any toolchain that produces PDBs, C++23 included
- Follows child processes and DLLs, and works with long-running services
- Choose which files and functions to track in a small YAML file
Read the workflow
Run your existing Windows executable with its PDB, collect coverage in a database, then convert it to LCOV for your reporting tools.
covdbg -c .covdbg.yaml -o coverage.covdb tests.exeIn your editor
Coverage in the editor, while you work.
The VS Code extension runs your tests under covdbg from the Test Explorer and marks each line in the gutter: green for lines that ran, red for lines that did not. You see the untested error path while you still have the code open.
- Run one test or the whole suite and see coverage a few seconds later
- Per-file percentages, refreshed on every run
- Uses the same database as the CLI, so the numbers match
Read the workflow
Run a test or a suite from Test Explorer. Coverage gutters identify lines that ran and lines that did not. Per-file coverage helps you find the untested paths while the code is open.
Test Explorer → Run tests → Inspect coverage guttersIn your pipeline
Review coverage in your pull requests.
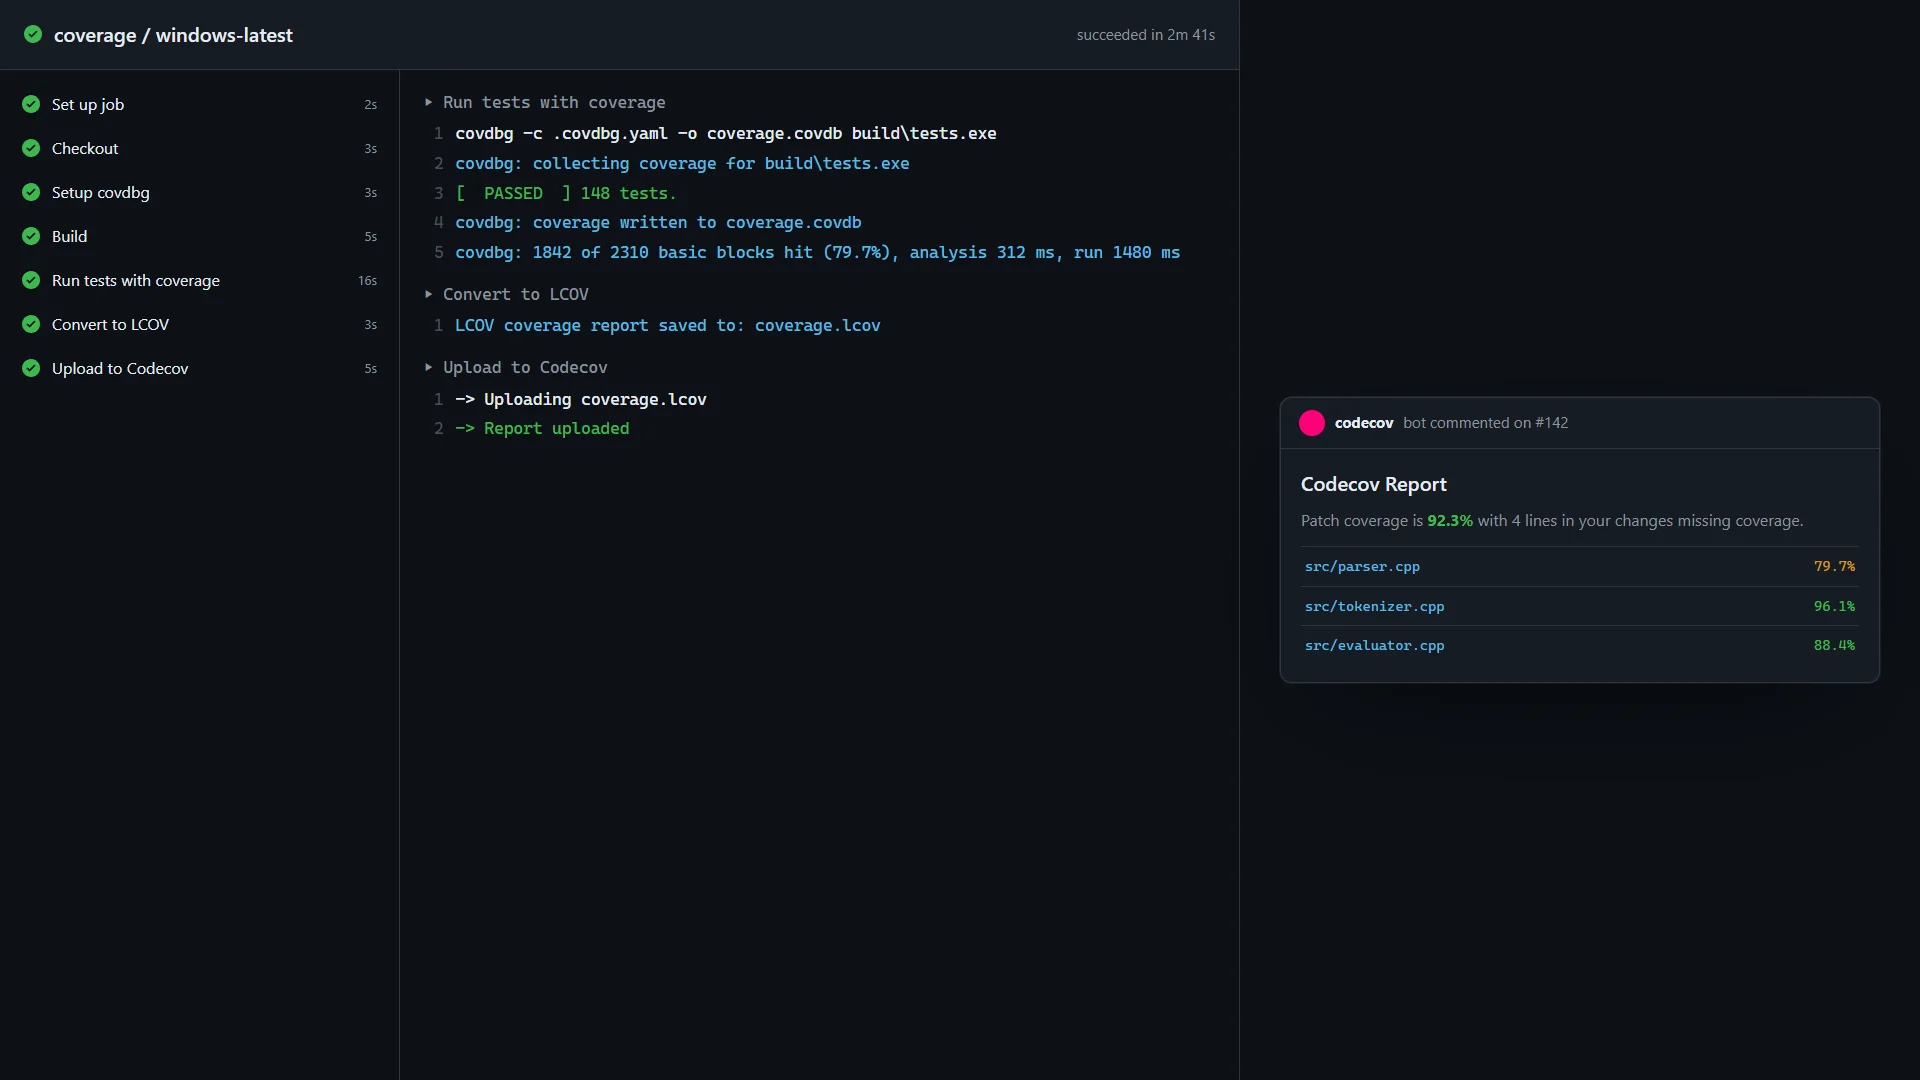
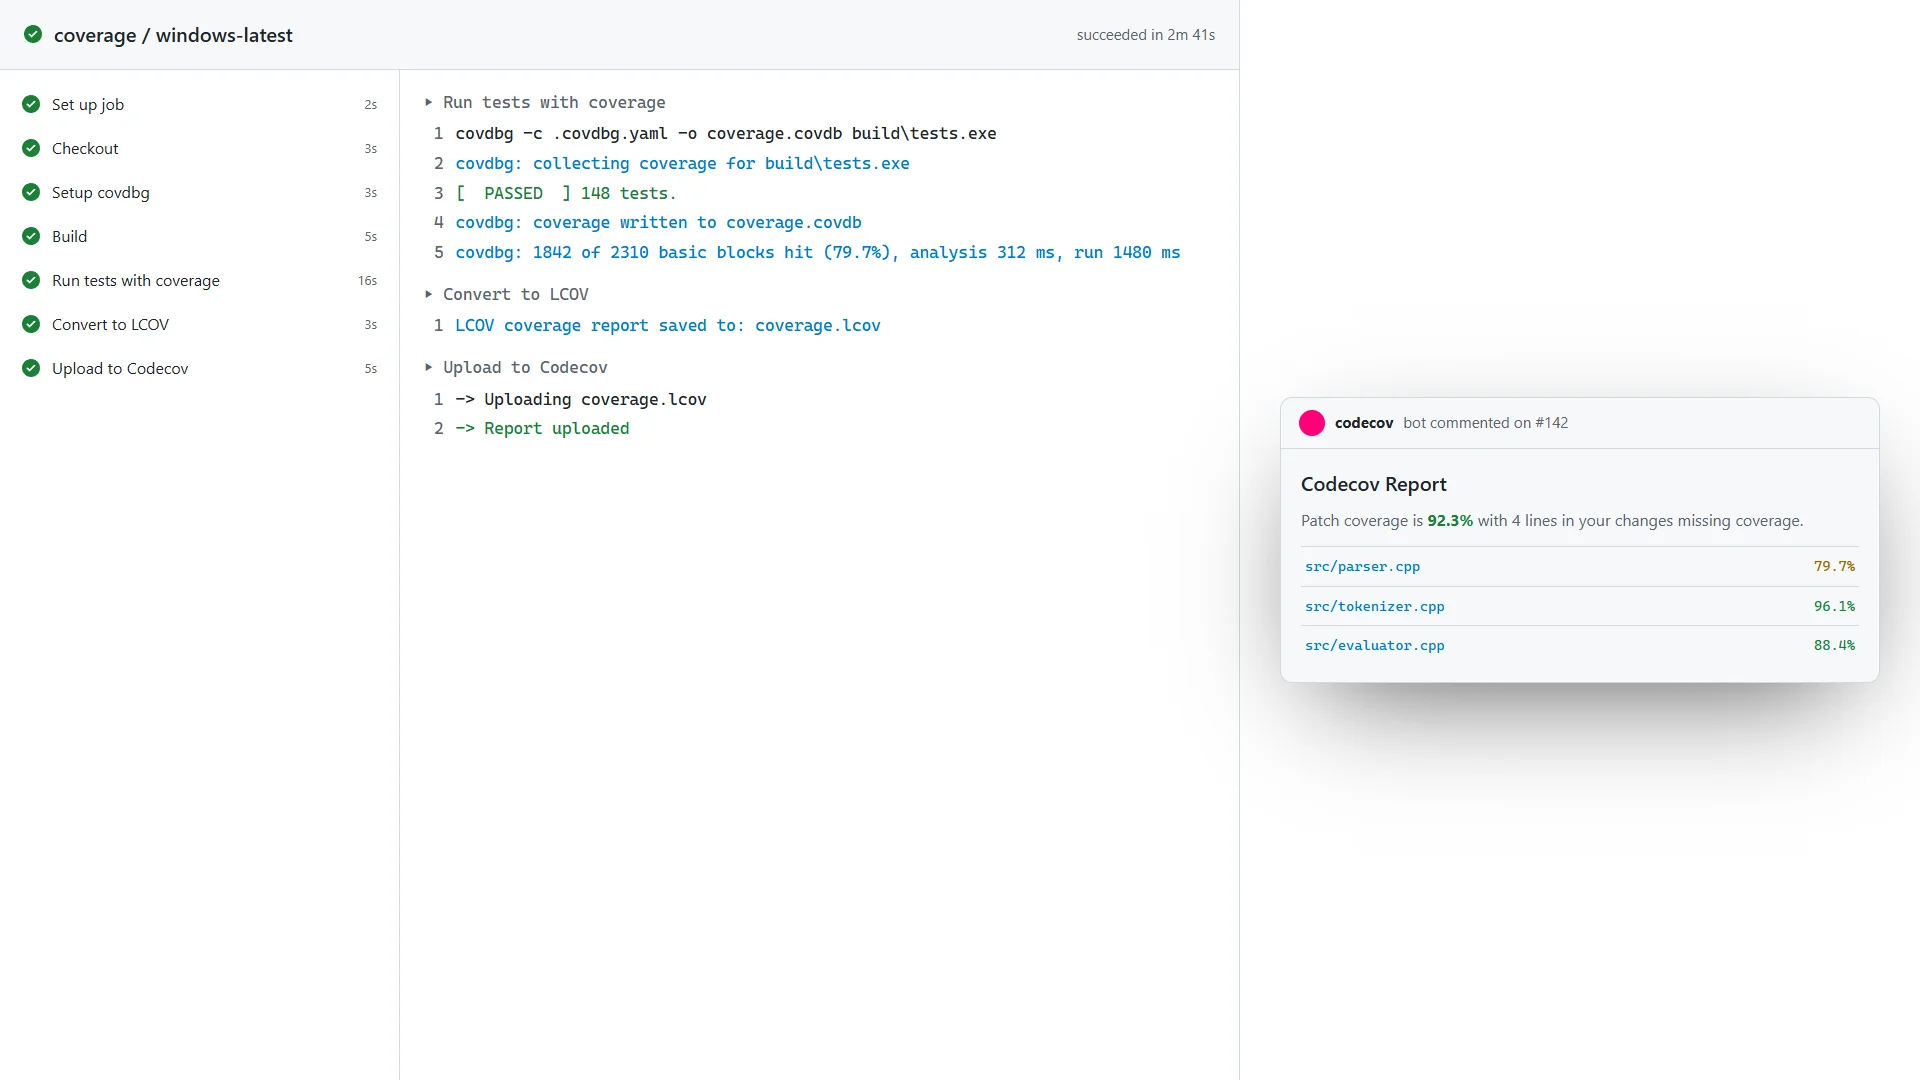
Add covdbg to GitHub Actions, Azure DevOps, or Jenkins with a project token, convert the result to LCOV, and upload it to Codecov or your own quality gate. The token covers every author with a seat, so nobody has to sign in on a build agent.
- First-class GitHub Action:
liasoft/setup-covdbg - Baseline coverage reports code that is not linked into a test as uncovered instead of leaving it out
- Merge parallel jobs into one report
Read the workflow
Use a project token to run covdbg in your pipeline. Export LCOV and upload the report to Codecov to see coverage on the pull request.
Run tests → Export LCOV → Upload coverageBuilt for every C++ team
For small projects and large ones.
The same tool works for a quick check during development and for the coverage rules a long-lived product needs.
Open source and personal projects
Free on every public repository, and on one private repository at a time.
Sign in once with GitHub, add the action to CI with a project token, and switch your private repository whenever you like at app.covdbg.com.
Teams
A seat per developer, every repository, all of CI.
Invite people by email, give the pipeline a project token, and get a coverage number on every pull request.
Larger organizations
Volume pricing, purchase orders, and annual invoicing.
Tell us how many developers you have and how your company buys software, and we put a quote together.
Try it first
Free for public and personal projects.
Use the same download on every plan. Start with public repositories or one private repository, and add team seats when you need them.
Free
$0
For personal use and open source.
- Unlimited public repositories
- One private repository at a time, switch any time
- CLI, VS Code, public CI with a project token
- LCOV and GCOV export
- Your own dashboard at app.covdbg.com
Team
$12per user / month
For teams: all repositories and CI.
- Unlimited private repositories, no lock
- CI project tokens cover all seated authors
- Priority support
Cancel any time.
Enterprise
Let's talk
For larger organizations.
- Volume pricing
- Purchase orders
- Annual invoicing
Tell us what your team needs.
Frequently asked questions
Do I need to recompile my code?
No. covdbg works with your existing binaries. Point it at an .exe or .dll built with debug symbols (PDB) and it handles the instrumentation at runtime. No compiler flags, no build system changes.
Which compilers are supported?
MSVC, and any compiler that produces Windows x64 binaries with PDB debug information. Modern language features up to C++23 are fully supported.
How much does covdbg cost?
It is free for open source and for personal use on one private repository. Teams pay $12 per user per month at app.covdbg.com. See the pricing page.
Is there a license key?
No. You sign in once per machine with covdbg login; in CI, a project token takes the place of the sign-in. The license service checks each run, and the result is cached so covdbg keeps working offline for a few weeks.
What does covdbg send to the license service?
The repository's git remote URL, the email address in your git configuration, and your sign-in or project token. After a run, one optional telemetry event with the covdbg version, the Windows version, run time, and exit code. Never source code, file names, or coverage data. The Data and Telemetry page lists every field.